Phase Two
Action and Assessment Plan
As Spring Break was approaching for my school site, the transition from Phase One to Phase Two happened very quickly. As I moved into phase two of my action research, not only were students’ needs analyzed, but also my own practices as an educator were thoroughly evaluated. As I transitioned from the first phase of my action research into the second phase, I made a few adjustments to my research question.
adjustments to my research question
As I mentioned, before starting Phase Two, I deeply reflected upon my research question rationalizing the ways I would modify it again to better suit the focus of my study, which was now on concentrated on increasing students behavioral engagement. My research question and sub-questions was modified accordingly:
- How can I support my students to become more engaged within on-task behaviors in the classroom to help support their academic learning?
- How can I incorporate student choice and inquiry into the classroom to help increase my students’ on-task behaviors?
Changes in my data collection
Within Phase Two, while I improved my research question, I also had to make some changes in the ways I collected and analyzed my data. First, I made the decisions that I would no longer be using the student self-assessment sheet as a form of data. I felt these assessments were not an accurate form of data nor did they provide me with the data I originally wished to gather in using and creating a self-assessment form. As illustrated in phase one findings, I discovered that there were few students who were able to honestly rate themselves a 4, 3, 2, or 1 while also being able to give a thorough explanation as to why they gave themselves this rating. Consequently, I was not able to accurately grasp students’ gain of cognitive engagement through the use of this form.
|
Additionally, I searched for an alternative option in which I could attempt to record my own observations of students’ engagement. I came to the decision I would add to my data what I will refer to as the Student Engagement Chart. This chart will replace the 4-3-2-1 rating system, in providing a more formal and detailed data analysis of student engagement. In Phase One, I had strictly collected observational data of student engagement. After speaking to my advisor about moving on to Phase Two and expressing my challenge in finding an accurate way of recording students’ engagement, she suggested I create a chart to show and collect quantitative data on observed student engagement during Genius Hour versus another time of the day. I found this to be useful advice and therefore decided that every 15 minutes, I would record students’ behavioral engagement (on-task and off task behaviors) using the following chart shown in Figure 12.
|
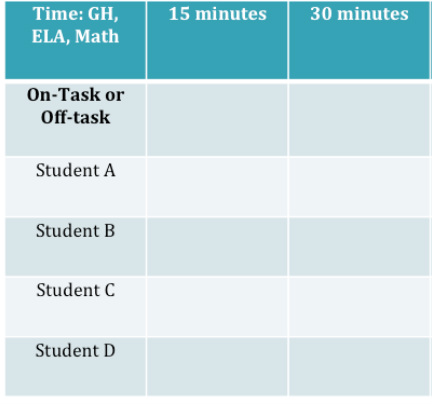
Figure 12: Student Engagement Chart
|
Correspondingly, I decided I use this same chart to record and analyze students’ behavioral engagement throughout other times of the day to show a comparison of two. As a Special Education Assistant, I am pushing into different grade levels throughout my workday; therefore, I was not able to choose a consistent time of the day or subject I was able to record data from to make my comparisons. Discussion of data now includes an analysis of the comparison of students’ behavioral engagement during Genius Hour versus other periods of the students’ day.
Phase Two Timeline
Phase Two was only six days long and took place during March 18 through March 26, 2014. As Spring Break was approaching, my school site only had one full week of instruction left, followed by a concluding week of entirely all minimum days. This left the students with only four days to prepare their presentations. As a reminder, student presentations served as the final part of the students overall project and students were to share with their classmates and I their learning experiences throughout the time of the project.
|
I planned for student presentations to occur on Tuesday of the following week. With the time constraint that occurred, I found myself limiting the students’ time in creating their presentations to ensure I was able to gather and collect all the necessary data before Spring Break approached. I then found that this also put a restriction on my students work as I will later discuss in my findings. Figure shows the timeline of Phase Two.
|
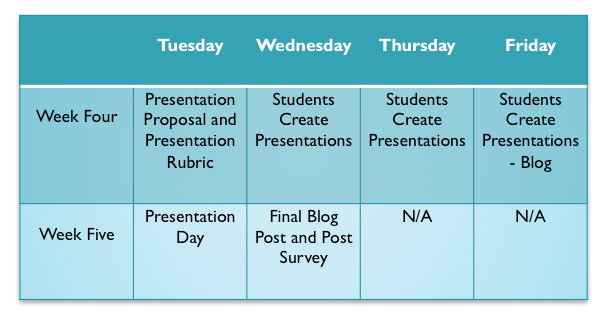
Figure 13: Phase Two Timeline
|
Data Collection and Assessment Tools
During Phase Two, I used four methods for gathering data: Student Blogs, Teacher Reflective Journal, Student Engagement Chart, and Post-Student Engagement Survey in order to measure students behavioral engagement.
Student blogs
Student Blogs continued to be used as one of my main forms of data. Not only did I recognize students’ on-task behaviors while using this technological tool, but I also found I was able to gain true insight feelings throughout this project. Students portraying their feelings with their posts also helped me gain a greater understanding of their increased levels of engagement. Although the time constraints of Phase Two only allowed for two more blog posts, I anticipated I would be able to gain more valuable reflective pieces from my students to add to the data about their own perceptions of their engagement.
Teacher Reflective journal
I also continued to utilize my journal and record my own classroom observations for the remainder of my study. Please also note, as I mentioned above, one of the changes I made in phase two, was to include a student behavioral engagement chart within my journal. As a reminder, every fifteen minutes of the hour, I opted to scan the room and record students on-task and off task behavior during Genius Hour and throughout another hour of the in which my scheduled allowed.
Student Engagement Survey
Furthermore, I continued to utilize the Student Engagement Survey but only measured the comparison of the questions from Phase One that regarded behavioral engagement, as this was now the focus of my research. Again, this survey will assist in providing me data on whether students’ views of engagement changed during the duration of the project.
Tying it all together
|
This triangulation of data collection methods was used throughout my action research to plan and help my answer research question and sub-question which was:
|
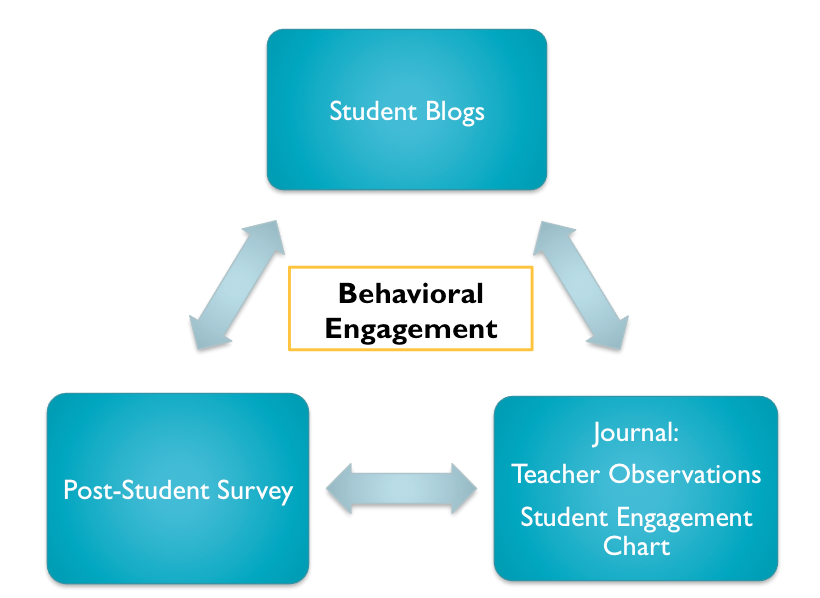
Figure 14: Triangulation of Data Phase Two
|
Phase Two implementation
In Phase Two, students moved on to the next step of their project, which was preparing a presentation to present their service-learning project to the class. As Spring Break was quickly approaching, time was limited. At the start of week four, it was made clear to the students they had exactly one week to prepare for their presentations and the following Tuesday would be presentation day. Looking back to Phase One, I found that my students expressed how they enjoyed having choice in their assignments and being able to utilize their creativity skills but I still found that they needed more structure than I had given them in Phase One. As I moved into planning Phase Two, I struggled with ways in which I would implement choice in such a small amount of time. As I referred back to my literature review, I remembered had stated that even providing student with a small choice such as allowing the student to pick their topic, studies showed student engagement could still increase. Therefore, I felt re-assured that while still allowing my students the small choice of choosing the manner in which they would present the project, students’ behavioral engagement could still increase.
Furthermore, as I stated structure and guidance was still needed with my classroom, I prepared a Presentation Proposal sheet for the students to use and fill to help guide their thinking while creating their presentations. The presentation proposal I created for the students can be seen in Figure. Additionally, student presentation choices can see in Figure.
Furthermore, as I stated structure and guidance was still needed with my classroom, I prepared a Presentation Proposal sheet for the students to use and fill to help guide their thinking while creating their presentations. The presentation proposal I created for the students can be seen in Figure. Additionally, student presentation choices can see in Figure.
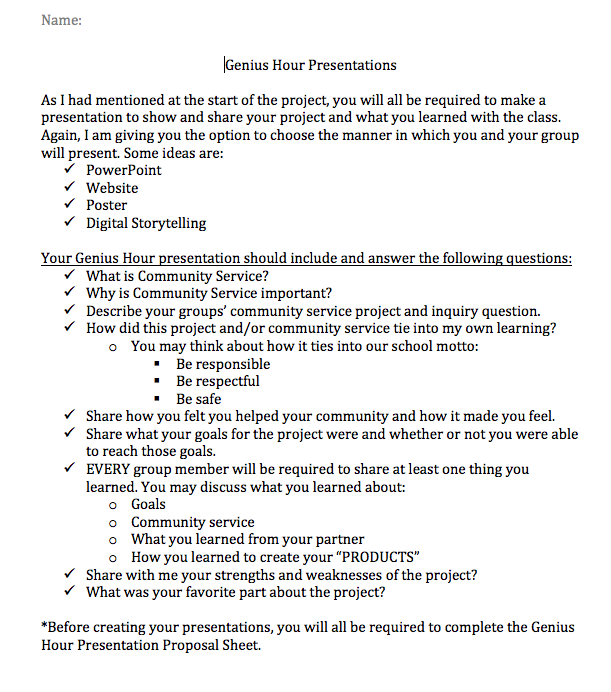
Figure 15: Presentation Proposals
|
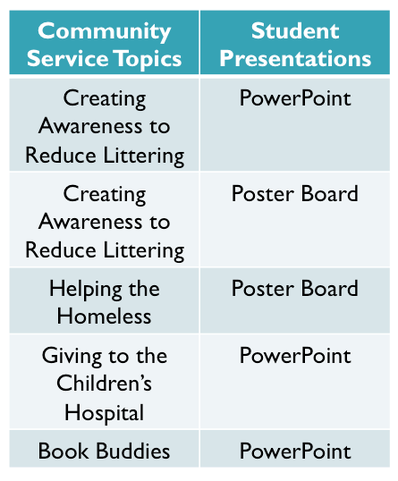
Figure 16: Student Presentation Topics
|
After the students and I completed the class discussion of the presentation guidelines, I released the students to their groups and allowed them the remainder of the hour to complete their proposals. For the remainder of the week, students used their time to craft their presentations.
Additionally, remembering during phase one, when the students had questioned me about how they were going to be graded, I thought perhaps having the students create their own rubric for their presentations would another option for student choice. Originally, I had chosen to leave out mentioning the grading process in phase one because I did not want students to limit their project inquiry or seek a project based on they were going to be graded but as they began to mention it, I sought for a way to implement grades and choice. Again, looking back in to the literature, I found when students collaborate in assessment they develop the habit of self-reflection (Warren, 1995). Warren provided a framework in which students are being required to take ownership of their learning process by developing their own syllabus, prioritizing topic areas, establishing peer accountability, and engaging in ongoing evaluation. My goal then with this was to allow students to further take ownership of their learning throughout the project in hopes they would assess their own efforts and feelings of accomplishment.
Additionally, remembering during phase one, when the students had questioned me about how they were going to be graded, I thought perhaps having the students create their own rubric for their presentations would another option for student choice. Originally, I had chosen to leave out mentioning the grading process in phase one because I did not want students to limit their project inquiry or seek a project based on they were going to be graded but as they began to mention it, I sought for a way to implement grades and choice. Again, looking back in to the literature, I found when students collaborate in assessment they develop the habit of self-reflection (Warren, 1995). Warren provided a framework in which students are being required to take ownership of their learning process by developing their own syllabus, prioritizing topic areas, establishing peer accountability, and engaging in ongoing evaluation. My goal then with this was to allow students to further take ownership of their learning throughout the project in hopes they would assess their own efforts and feelings of accomplishment.
|
Accordingly, on day one of Phase Two, the students elicited what a good presentation might look like and then we proceed to discuss the ways in which they believed they should be graded on their presentations. Some of the students’ responses were: "We should graded on how we are standing" and "I think we should get graded on how much information we have." To keep the grading scale, we agreed on using a liker scale as well. In the end, as a class we agreed on the utilizing the following rubric as seen in Figure
|
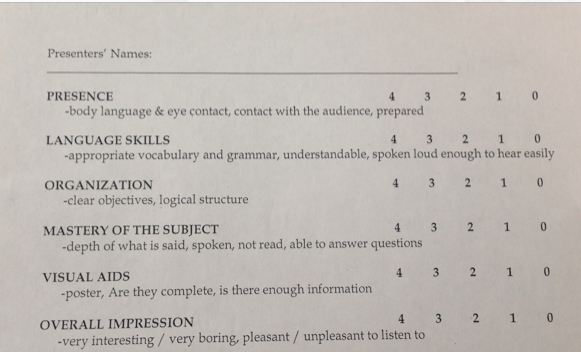
Figure 17: Student Presentation Rubrix
|
Finally, on the concluding day of the project, which was also the last day before students went on Spring Break, students completed their final blog post. I had recognized that this blog was much more lengthy in the questions it asked, as I asked students to not only reflect on the final presentations but the project, student choice, and Genius Hour as a whole. To end, students were also given the post-student survey, which again was only used to measure their behavioral engagement in comparison to the start of the project.
Phase two Data Analysis and Findings
After analyzing that data in Phase Two, I found the following themes to emerge:
Incorporating choice leads to greater on-task participation
|
When analyzing the Student Behavioral Engagement Chart, I found that the students’ on-task behavior was slightly higher than during Genius hour than during Math and English Language Arts (ELA). As you can see in Figure 18, the data for students’ on-task behavior for the week of presentations was always greater during Genius Hour and more students seemed to be on-task more frequently within the middle of the hour than in the beginning and the end of the hour. I also noted in my Teacher Observation Journal “Student’s given choice during Math to work with partners.” I found two interesting factors when analyzing the data. First, even though given a choice in Math, Genius hour on-task participation was still greater.
|
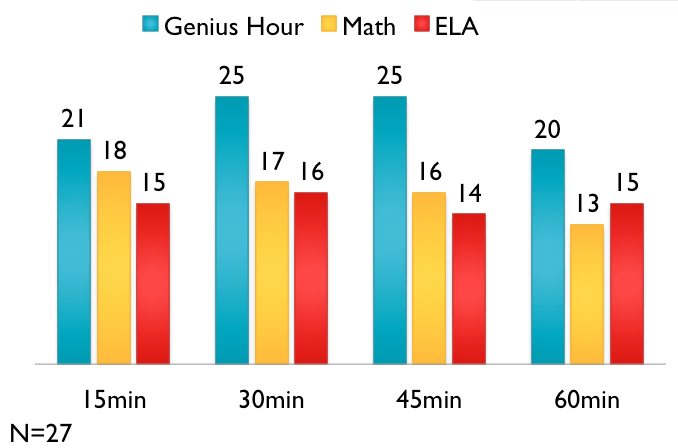
Figure 18: Student Behavioral Engagement Data
|
I also noticed that they day that students were given the choice to work with partners in math, their on-task behaviors were also greater compared to the other three days of the week when not given the choice to work with peers. This led me to concur with (add name) in stating that even with providing students with small choices, engagement increases.
Choice takes time
When reviewing student presentation choices, initially, I was a little saddened that all the groups chose to simply create the custom PowerPoint or poster board for their presentation style. I anticipated that students would take part in the other forms of presentation styles that were introduced such as creating a website or video since they showed an interest in the use of technology and furthermore, had initially at the start of their project expressed interest in using these styles of presentation. Recalling students’ interest in making a movie, website, and play, I approached the students and reminded them of this. I proceeded to ask the students if they were still interested in these presentation styles. I got the following responses: “Well, we already know how to do a PowerPoint and it will be easier to finish then making at website” as well as “Um, this is easier and there might not be enough time for a play”. I found that time played a role in the decision and the students might have felt that they really had much a choice at this moment due to the time constraint.
Additionally, I did have one group that choose to use an alternative presentation and opted in creating a digital storyboard. Yet again, I found that the factor of time played a part in their ultimate decision. On the second day of creating presentations, when checking in on the students, I found this particular group to be creating a PowerPoint. When I questioned the use of their digital storyboard, they responded with “It was taking a long time” and that the work that had completed the day before did not save properly, therefore they didn’t want to start all over because “it’s going to take a long time and we want to make sure we get a good grade.” I found that with the factor of time, it limited students’ work and how they perceived their abilities. According to Carl Rogers’ (1980) humanistic pedagogy, humans behave in accordance with how they perceive their situation. The students, in this case, saw the time was a limiting factor and were more concerned with having a complete presentation and good grade and choose to create a presentation they knew they were capable of completing versus challenging themselves to complete a task they were unsure of.
Additionally, I did have one group that choose to use an alternative presentation and opted in creating a digital storyboard. Yet again, I found that the factor of time played a part in their ultimate decision. On the second day of creating presentations, when checking in on the students, I found this particular group to be creating a PowerPoint. When I questioned the use of their digital storyboard, they responded with “It was taking a long time” and that the work that had completed the day before did not save properly, therefore they didn’t want to start all over because “it’s going to take a long time and we want to make sure we get a good grade.” I found that with the factor of time, it limited students’ work and how they perceived their abilities. According to Carl Rogers’ (1980) humanistic pedagogy, humans behave in accordance with how they perceive their situation. The students, in this case, saw the time was a limiting factor and were more concerned with having a complete presentation and good grade and choose to create a presentation they knew they were capable of completing versus challenging themselves to complete a task they were unsure of.
Community Service and its role on student engagement
In the second phase of my study, I observed and recorded in my Teacher Journal more off-task behaviors as opposed to Phase One. Although my data collection showed that students’ on-task behaviors were greater within the Genius Hour time frame, I observed more wandering, peer-distraction, and the students repeatedly asking questions regarding directions occurring within the hour. I began to wonder why this was so. As I was re-reading through students’ blog posts, I came to the realization that many students stated they enjoyed their projects because “they got to help someone.” I then began to wonder what role employing the aspect of community service within the classroom played on student engagement. I also began to speculate that students’ engagement within Phase One could have been one of the main factors of their engagement versus the actual notion of choice itself. When reviewing the literature on service learning, I found that, according to Cooper and Pace (2004) service learning teaches specific character traits including: responsibility, self-control, cooperation and teamwork, and respect and appreciation for diversity (p. 375). Looking back at my data collected within using the Student Engagement sheet, I began to also ponder if students’ on-task behaviors were only slightly higher than Math and ELA because they were no longer employing their service learning project but creating a presentation instead. At this time, I wish I would had conducted an exit slip or interviews with the students to understand if it was choice and the aspect of community service that was of interest to them.
Providing Choice increase students BEHAVIORAL engagement
|
One of my data collection methods was to conduct and pre-and post-survey measuring students engagement. In Phase One, I sought to measure cognitive, behavioral, and emotional engagement but as my study progressed in Phase Two, I only focused on measuring behavioral engagement. I found a positive increase my students’ self-perceptions of their behavioral engagement. As you can see in Figure 19, the results were as followed:
|
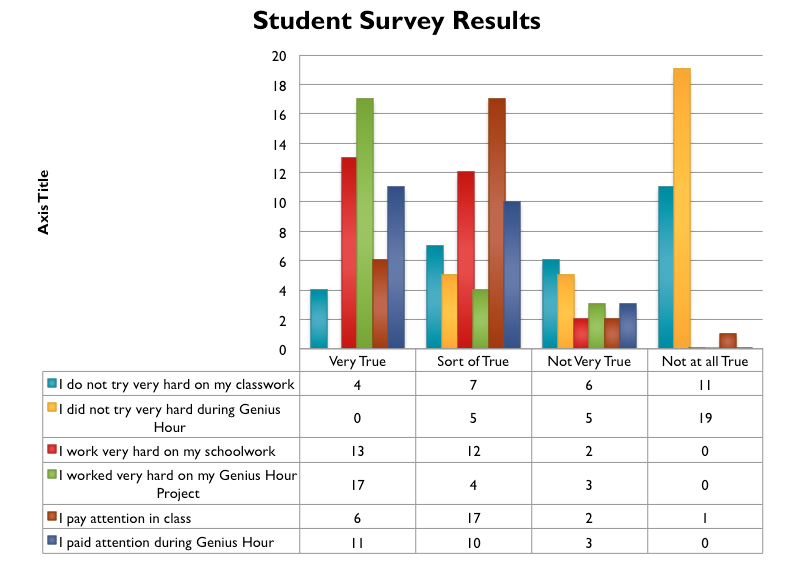
Figure 19: Post-Survey Data (Behavioral Engagement)
|
In found in my pre-survey, 11 out of my 27 students stated that they did “try hard” on their classwork, 19 out of my 27 students stated they did try hard during Genius Hour. Also, I found that 11 out of 27 of my students claimed “very true” in paying attention during Genius Hour, where as only 6 claimed this the pre-survey. These results showed me that students’ behavioral engagement increased with the implementation of Genius Hour.
Students show more confidence and passion in their work
In many instances, I observed students showing more passionate work. Whether it was taking the time to accomplish and complete the task to the best of their ability, asking to stay in at recess to continue working on their project, working on aspects of their project at home, and even expressing in their blogs “I like Genius Hour because it makes me think a lot but it is also fun and I get to be creative”, all of these instances characteristics I had not previously seen from these students. I was pleasantly surprised in particular students who expressed little interest in their project initially, but when realizing their potential, they became more actively engaged and off-task behaviors decreased. For example, in one particular who was creating drawings to give to the children in the children’s’ hospital stated in his blog “ My favorite part was creating the drawings. I learned that I can draw and pay attention.” Even though this was a minor improvement, coming from a student who continuously shows little interest in his school assignments and expresses not having any interests, seeing his true potential, I saw it as an opportunity to find ways to continue to engage him and also help him to continue to find his interests.
Another moment of bliss that stood out for me is when the “Littering” group presented their project and taught the students about littering by playing a game where the second graders had to identity which items could be recycled. At the end of my students’ presentations, one second grader raised her had and thanked them for presenting and made the statement, “We are really lucky you chose our class to play this game with!” As we were walking back to class, my students expressed to me that statement made them feel really good about their work. As a group, they stated that this presentation “made them feel really good and more confident.” They also expressed to me that this project made them want to continue to reduce littering in the school and they even asked if they could share ideas with other classes.
Another moment of bliss that stood out for me is when the “Littering” group presented their project and taught the students about littering by playing a game where the second graders had to identity which items could be recycled. At the end of my students’ presentations, one second grader raised her had and thanked them for presenting and made the statement, “We are really lucky you chose our class to play this game with!” As we were walking back to class, my students expressed to me that statement made them feel really good about their work. As a group, they stated that this presentation “made them feel really good and more confident.” They also expressed to me that this project made them want to continue to reduce littering in the school and they even asked if they could share ideas with other classes.
Phase three: Where do i go from here?
I discovered in Phase One and Phase Two that when providing my students with choice in their assignments, an increase of behavioral engagement occurred, more specifically on-task participation. Although this study did provide evidence that my students did enjoy having choice within their assignments, it was also obvious that the factor of time became a limitation in their choice making, which initially I had not anticipated. Furthermore, I also became more conscious that the factor of community service itself might have also been a main factor of students’ increased behavioral engagement. When given the time and opportunity, here are some possible implementations that I would consider addressing for Phase Three.
Cognitive, BEHAVIORAL, and emotional Engagement
First, when I have the opportunity to perform this action research again, I would like to attempt to measure the three elements of engagement, cognitive, behavioral, and emotional. Originally, in the beginning of my study, I tried to measure the three elements only to realize I could not do so with the limitation of time within my study. Now, understanding student engagement on a greater level, I recognize that the meta-construct plays an important role and now that it is more visible to me, I would like to measure all three elements, respectively. Although, all three elements can be measured apart from one another, they are still entwined and composed to increase engagement, completely. Furthermore, I believe this in beneficial in attempt to meeting all students’ needs. Therefore, with a greater amount of time, my goal is to find implementations and measure the ways they can increase student engagement and reach all my students.
Independent student inquiry
Another possible intervention I would like to make is changing my group student inquiry to individual student inquiry. Normally, within Genius Hour, students choose individual inquiry. For the scope of my study, I opted to allowing student groups as a factor of choice and two, due to my own limitations and felt have 27 students completing an individual in-class project would have been too much for the time frame I was given. Next time around, I would like to have my students come up with their own inquiry, and have their focus be more pertained to their own individual passions and interests versus a class interest of community service. I estimate the students’ engagement levels will increase more with their own passion within their projects.
Community Service
Lastly, I would like to explore community service more in depth as an intervention for student engagement alone. In this study, because my main intervention was geared towards student choice, I did not focus on the effects of community service on student engagement. As I mentioned, in my data analysis a great amount of students expressed “helping someone” was their favorite part of the project, which led me to believe that it could have been possible that student engagement could have increased due to the implementation of community service. As this service project the students completed, I found, let student's explore more of their creative sides, I would like to structure a service learning project within a particular curriculum such as character education, and measure how that increases student engagement. According to O'Keefe (1997) "community service and service learning programs for children provide character education in action, inculcating within them the values of public community" (p.54). I beleive this type of learning can also provide student with experience in a true to life environment, teaching the students good citizenship, respect, meaningful learning experiences, and character building (p.56). Therefore, exploring service learning in the future would be of great interest to me.
